😷 Covid Tracker
Goal
A ground-breaking product that provides timely evidence-based, location-based, specific information about Covid-19 cases in our community, all the way down to the county level.
Role
Product Designer
Softwares
Sketch | Invision | Mapbox
Duration
Mar 2022 - October 2022

Overview
Selected as one of four designers for an overnight pop-up squad, this project delivered trusted, location-specific Covid-19 data all the way down to the county level — built in one of the fastest product cycles of the team's careers.

The Problem
In March 2020, the pandemic brought an avalanche of misinformation. People needed a single trusted source for facts, not speculation, backed by authoritative data.
The Solution
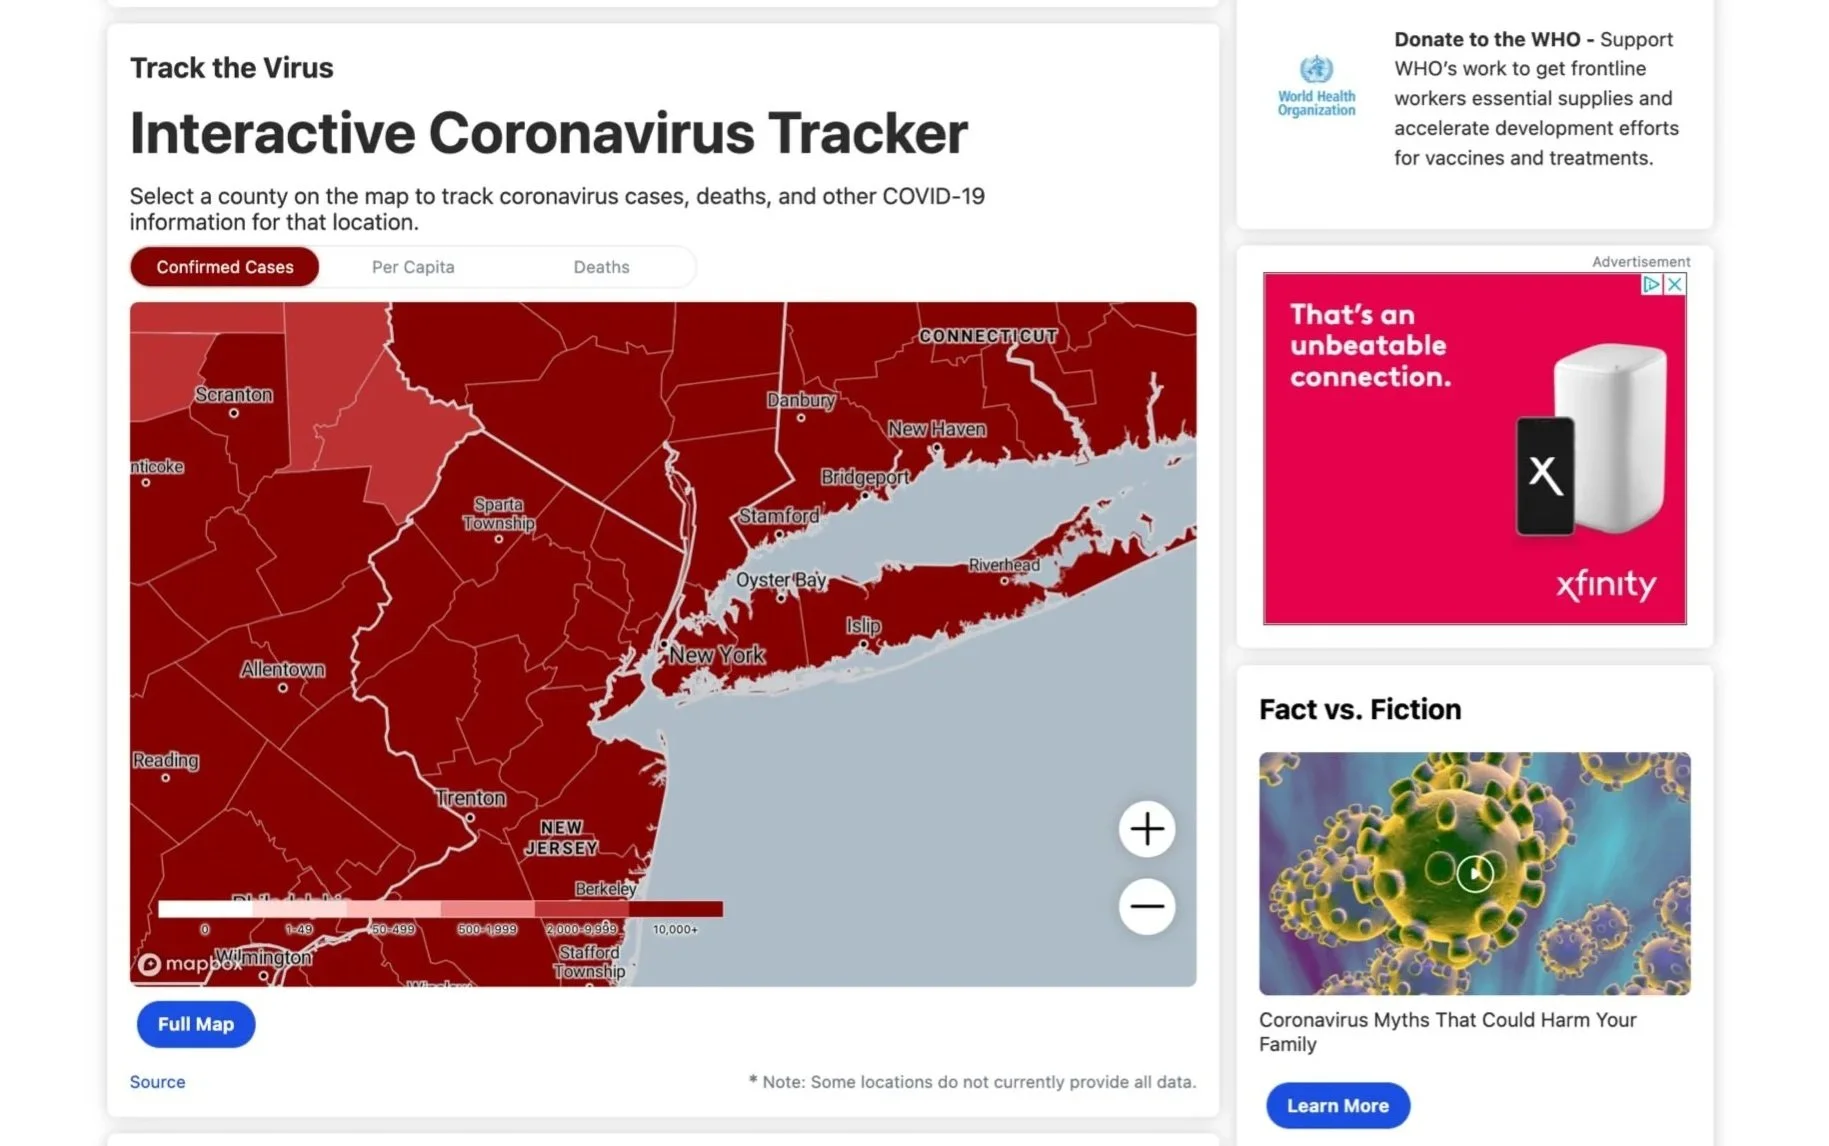
Leverage existing weather data infrastructure to deliver clear, county-level Covid statistics through an interactive map, approachable charts, and an AI chatbot.
Interactive Map Process
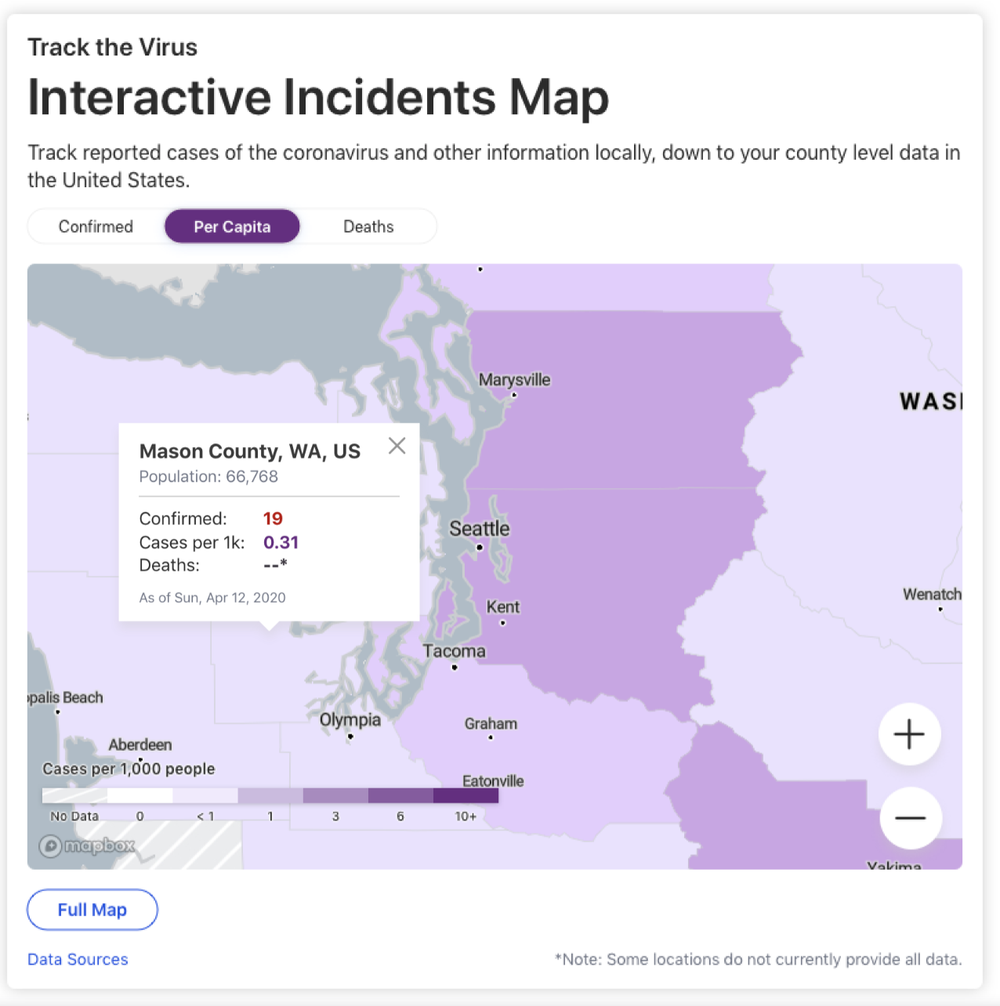
Data was organized into three distinct layers to keep the map readable and accessible. Color choices were co-developed with Mapbox to ensure accessibility and clarity.
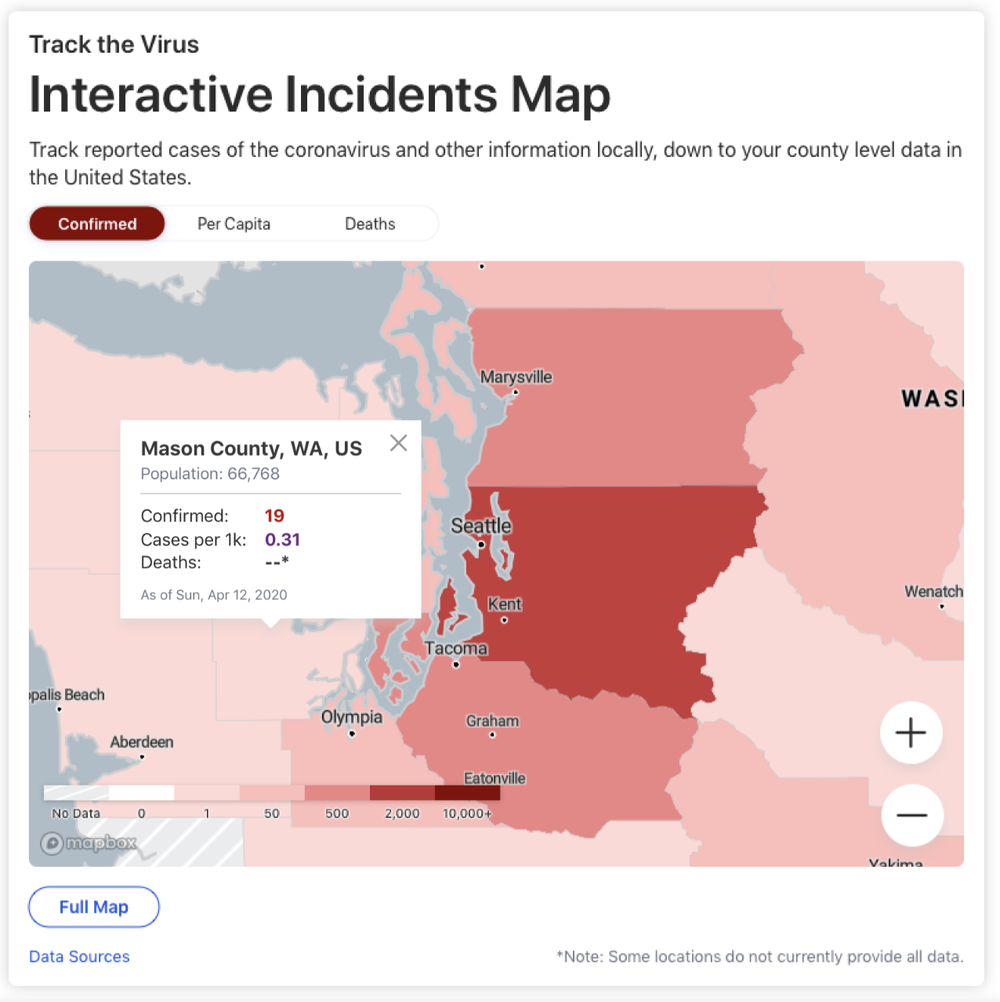
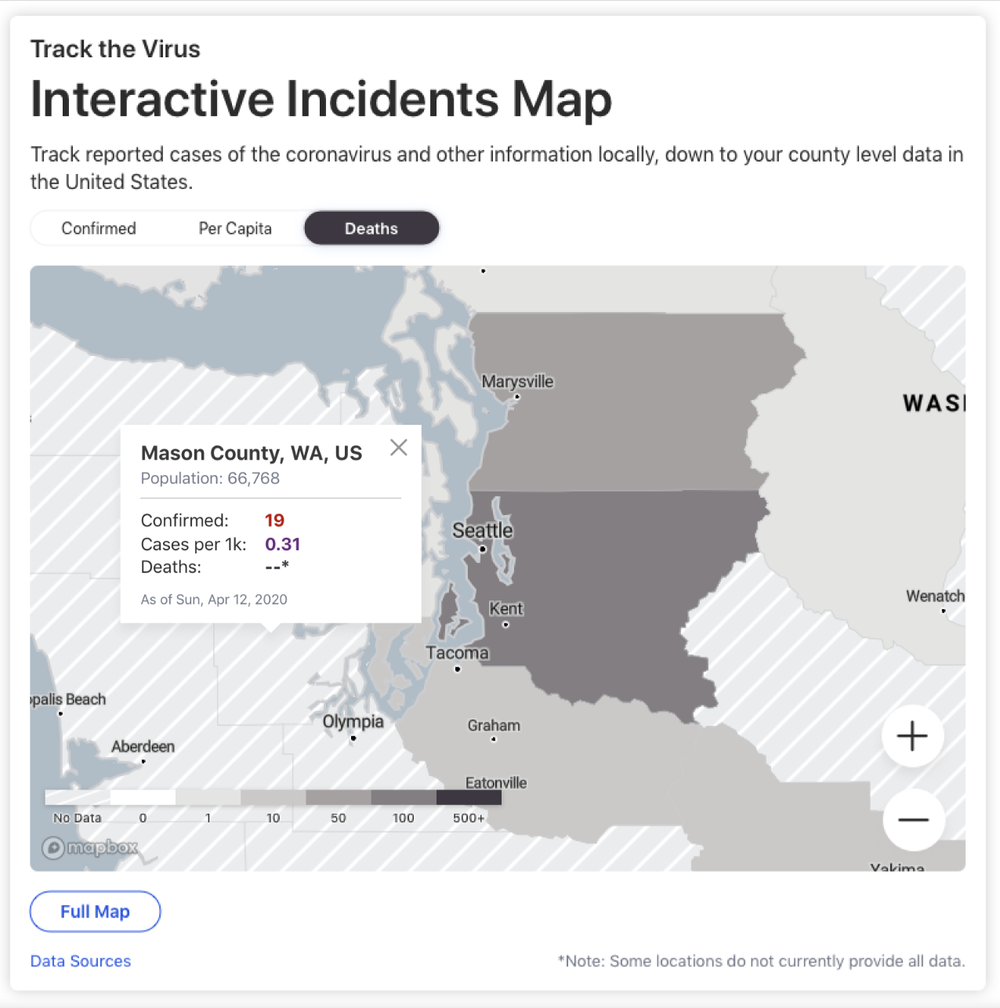

What it looked like in practice
Partnered with the SUN and Pangea data teams to build on The Weather Channel's existing map infrastructure. Collaborated with Mapbox's in-house team to develop the color language for each data category — ensuring visual clarity and accessibility — then learned Mapbox Studio hands-on to integrate the final skin with Engineering.
The tracker launched in the US before expanding worldwide, with each release requiring close work with our translation team to ensure designs held up across different languages and text lengths.


Takeaways
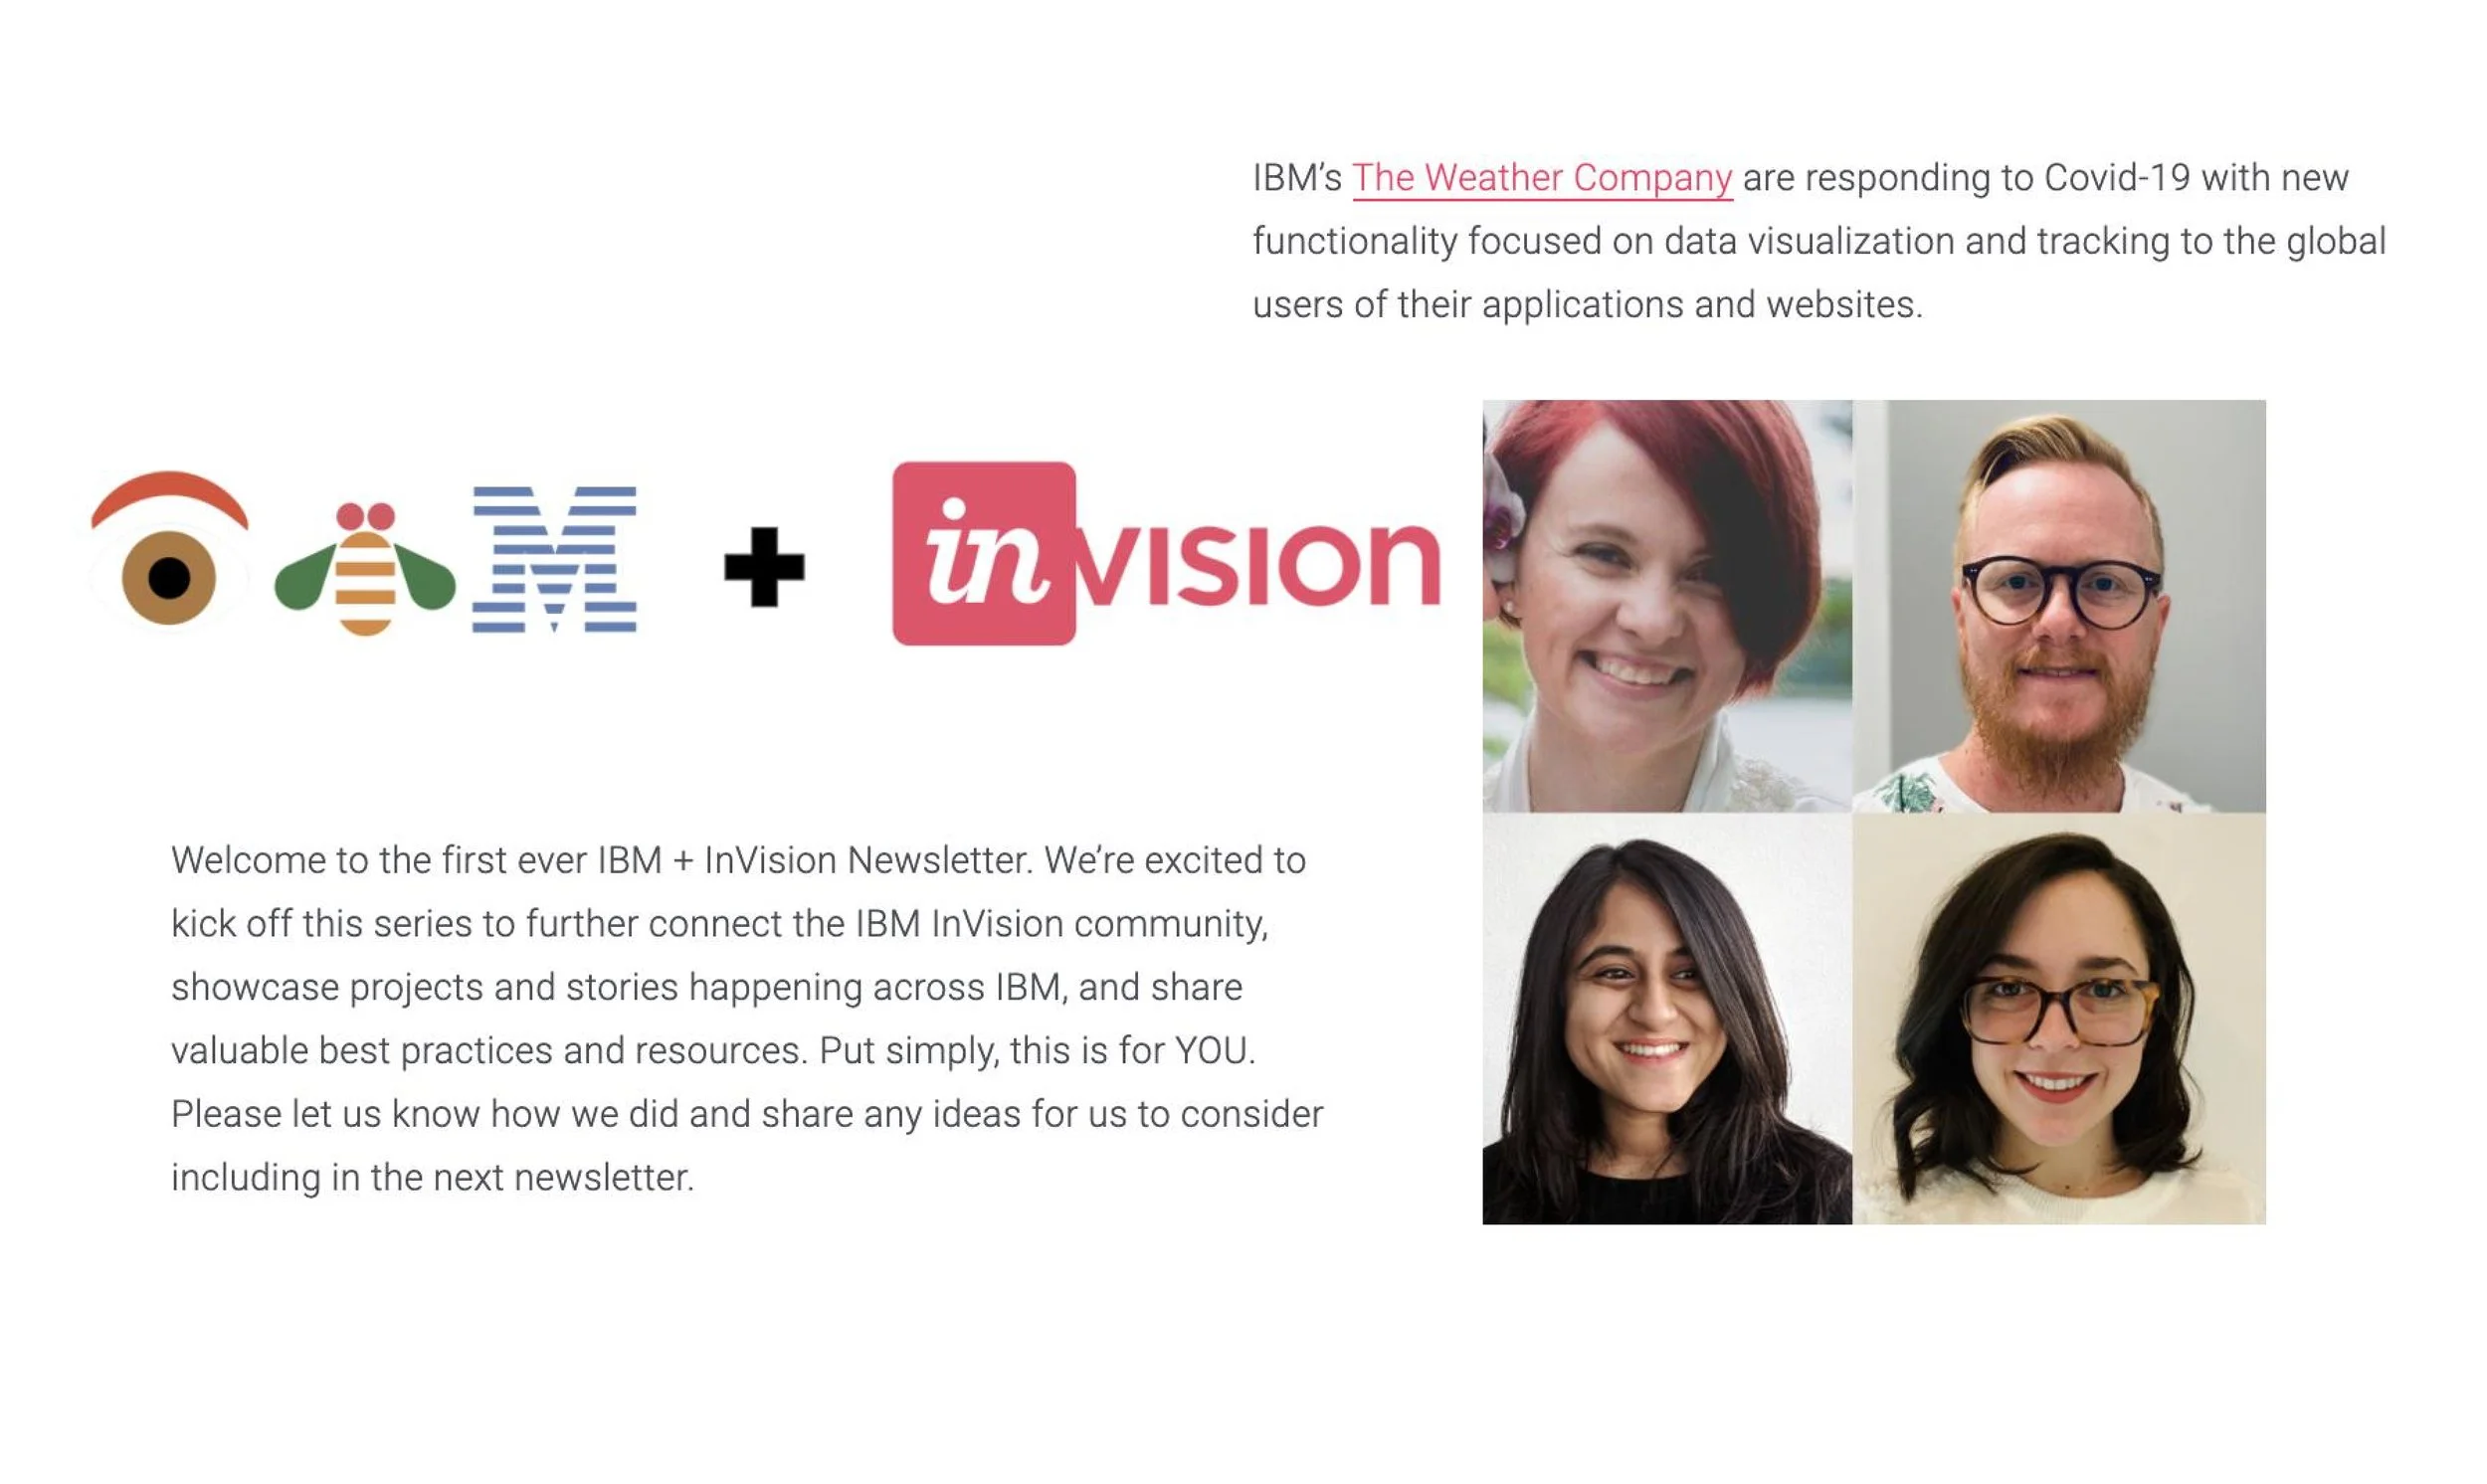
A surprise call with then-IBM CEO Ginni Rometty - who spoke about our work on CNN - and a feature in the first-ever IBM × InVision newsletter were standout moments of recognition. But the real highlight was shipping something innovative and accessible to 45 million users at exactly the right moment, and knowing that good design at scale actually reaches people.